EVV Dashboard
The EVV Dashboard offers an array of information pertaining to the Electronic Visit Verification (EVV) methods utilized at HHAX. With emphasis on compliance, this dashboard displays monthly trends, compliance ratios, exceptions, various types of visits, as well as data indicating where Coordinators stand in meeting compliance standards (by ratio, exceptions, and visits).
The EVV Homepage Dashboard is comprised of several cards offering a high-level view of percentages and trends for EVV Compliance, Unconfirmed Visits, Short or Late Start Visits, Mobile Adoption, Missed Visits, and Total Visits, as seen in the image below.
Refer to the Navigating Dashboards section to learn how to navigate in this dashboard.

EVV Homepage Dashboard
This section covers the EVV Dashboard, offering a view of each page and descriptions of the cards and widgets.
Use the filter feature, on the right pane of the screen to generate results for specific criteria (such as Date Range, Office, Caregiver, EVV Type, etc.). Filter options may vary according to the selected widget, or card.
EVV Compliance (Non-Compliant Visits)
The image below illustrates the Non-Compliant Visits set of cards and widgets.

EVV Dashboard: Non-Compliant Visits
Cards – Non-Compliant Visits
EVV Compliance cards are described in the following table.
|
Card |
Description |
|---|---|
| Non-Compliant Visits # |
Number of Non-Compliant visits in the last week and the comparison to the previous week. |
| EVV Compliance % |
Percentage of EVV-compliant visits (Confirmed, excluding Exceptions) for the week in comparison to the prior week. |
| Total Visits |
Total number of visits in the last week and the comparison to the previous week. |
| Total Patients Impacted |
Total number of Patients (Members) visited in the past week and the comparison to the previous week. |
Widgets – Non-Compliant Visits
EVV Compliance widgets are described in the following table.
|
Widget |
Description |
|---|---|
| # of Non-Compliant Visits |
Compare the number of Non-Compliant visits by Payer. Click on one or more bars to focus on specific Payers. From the Change Dimension dropdown field, select by Payer, Caregiver, Contract, Office, Service Code, or Coordinator to view specific details.
Click on the View Data magnifying glass icon ( |
| Reason for Non-Compliant Visits |
Displays the number of Non-Compliant visits by Non-Compliance reasons and the frequency (number) the reason is used. |
| # of Non-Compliant Visits by Week |
This graph displays the total number of Non-Compliant visits trend by week. Select one or more specific Payers from the Add Payer into Chart dropdown field to view a comparison. |
 ) at the top header of the page to view the Non-Compliant Visits Report. Report data can be sorted by columns and downloaded in Excel or CSV format.
Unconfirmed Visits
The image below illustrates the Unconfirmed Visits set of cards and widgets.
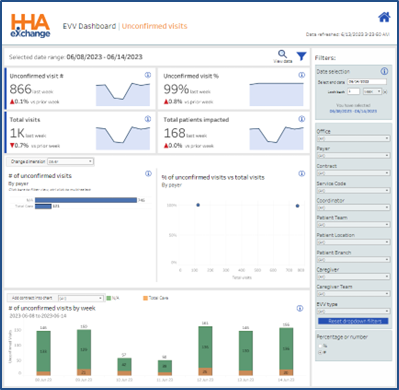
EVV Dashboard: Unconfirmed Visits
Cards – Unconfirmed Visits
Unconfirmed Visits cards are described in the following table.
|
Card |
Description |
|---|---|
| Unconfirmed Visits # |
Number of Unconfirmed visits in the last week and the comparison to the previous week. |
| Unconfirmed Visits % |
Percentage of Unconfirmed visits (excluding Missed Visits) for the week in comparison to the prior week. |
| Total Visits |
Total number of visits in the last week and the comparison to the previous week. |
| Total Patients Impacted |
Total number of Patients (Members) impacted by Unconfirmed visits for the past week and the comparison to the previous week. |
Widgets – Unconfirmed Visits
Unconfirmed widgets are described in the following table.
|
Widget |
Description |
|---|---|
| # of Unconfirmed Visits by Payer |
Compare the number of Unconfirmed visits by Payer. Click on one or more bars to focus on specific Payers. From the Change Dimension dropdown field, select by Payer, Caregiver, Contract, Office, Service Code, or Coordinator to view specific details.
Click on the View Data magnifying glass icon ( |
| % of Unconfirmed Visits vs Total Visits by Payer |
Plot graph displays the percentage of Unconfirmed visits versus the total number of visits. |
| # of Unconfirmed Visits by Week |
This graph displays the total number of Unconfirmed visits trend by week. Select one or more specific Payers from the Add Payer into Chart dropdown field to view a comparison. |
Short or Late Start Visits
The image below illustrates the Short or Late Start Visits set of cards and widgets.

EVV Dashboard: Short or Late Start Visits
Cards – Short or Late Start Visits
Short or Late Start Visits cards are described in the following table.
|
Card |
Description |
|---|---|
| Short or Late Start Visits # |
Number of Short or Late Start visits in the last week and the comparison to the previous week. |
| Short or Late Start Visits % |
Percentage of confirmed visits that are shorter than the scheduled duration or that began later than scheduled start time in comparison to the prior week. |
| Total Visits |
Total number of visits in the last week and the comparison to the previous week. |
| Total Patients Impacted |
Total number of Patients (Members) impacted by Short or Late Start visits for the past week and the comparison to the previous week. |
Widgets – Short or Late Start Visits
Short or Late Visits widgets are described in the following table.
|
Widget |
Description |
|---|---|
|
# of Short or Late Start Visits by Payer |
Compare the number of Short or Late Start visits by Payer. Click on one or more bars to focus on specific Payers. From the Change Dimension dropdown field, select by Payer, Caregiver, Contract, Office, Service Code, or Coordinator to view specific details.
Click on the View Data magnifying glass icon ( |
|
% of Short or Late Start Visits by Duration |
Displays the number of Short and Late Start Visits by duration (showing how short or late a visit is). |
|
# of Short or Late Start Visits by Week |
This graph displays the total number of Short and Late Start visits trend by week. |
Mobile Adoption
The image below illustrates the Mobile Adoption set of cards and widgets.

EVV Dashboard: Mobile Adoption
Cards – Mobile Adoption
Mobile Adoption cards are described in the following table.
|
Card |
Description |
|---|---|
| Mobile Adoption % | Percentage of EVV in the last week and prior week. |
| Mobile Adopted Visits # | Number of EVV visits for the last week in comparison to the prior week. |
| Manual Visits | Number of manually verified visits. |
| Total Visits | Total number of visits in the last week and the comparison to the prior week. |
Widgets – Mobile Adoption
Mobile Adoption widgets are described in the following table.
|
Widget |
Description |
|---|---|
|
# of Visits using Mobile App by Payer |
Compare the number of EVV adopted visits by Payer. Click on one or more bars to focus on specific Payers. From the Change Dimension dropdown field, select by Payer, Caregiver, Contract, Office, Service Code, or Coordinator to view specific details.
Click on the View Data magnifying glass icon ( |
| # of Visits using EVV Type | Displays the number of EVV adopted visits by source of visit. |
| # of Visits using Mobile App by Week | This graph displays the total number of EVV Visits trend by week. Select one or more specific Payers from the Add Payer into Chart dropdown field to view a comparison. |
Missed Visits
The image below illustrates the Missed visits set of cards and widgets.

EVV Dashboard: Missed Visits
Cards – Missed Visits
Missed visits cards are described in the following table.
|
Card |
Description |
|---|---|
| Missed Visit # | Number of visits that never took place (selected as Missed in the Visit Info tab) in the last week and prior week. |
| Missed Visit % | Percentage of visits that never took place (selected as Missed in the Visit Info tab) in the last week and prior week. |
| Total Visits | Total number of visits in the last week and the comparison to the previous week. |
| Total Patients Impacted | Number of Patients impacted by Missed visits. |
Widgets – Missed Visits
Missed visits widgets are described in the following table.
|
Widget |
Description |
|---|---|
|
# of Missed Visits by Payer |
Compare the number of EVV adopted visits by Payer. Click on one or more bars to focus on specific Payers. From the Change Dimension dropdown field, select by Payer, Caregiver, Contract, Office, Service Code, or Coordinator to view specific details.
Click on the View Data magnifying glass icon ( |
| Missed Visit Reason | Displays the number of Missed visits by Reason. |
| # of Missed Visits by Week | This graph displays the total number of Missed visits trend by week. Select one or more specific Payers from the Add Payer into Chart dropdown field to view a comparison. |
Total Visits
The image below illustrates the Total visits set of cards and widgets.

EVV Dashboard: Total Visits
Cards – Total Visits
Total visits cards are described in the following table.
|
Card |
Description |
|---|---|
| Total Visits | Total number of visits in the last week in comparison to the previous week. |
| Non-Compliant Visits # | Number of Non-Compliant visits in the last week in comparison to the previous week. |
| Unconfirmed Visits # | Number of visits that took place without confirmation (excluding Missed visits) in the last week and the prior week. |
| Short or Late Start Visits # | Number of confirmed visits that are shorter than the scheduled duration of that began later than scheduled start time in the last week in coparison to the prior week. |
Widgets – Total Visits
Total visits widgets are described in the following table.
|
Widget |
Description |
|---|---|
|
Total Visits by Payer |
Compare the total number of visits by Payer. Click on one or more bars to focus on specific Payers. From the Change Dimension dropdown field, select by Payer, Caregiver, Contract, Office, Service Code, or Coordinator to view specific details.
Click on the View Data magnifying glass icon ( |
| Breakdown of Total Visits | Displays the number of visits compared to other metrics in the dashboard. |
| Total Visits by Week | This graph displays the total number of visits trend by week. Select one or more specific Payers from the Add Payer into Chart dropdown field to view a comparison. |