Navigating Classic Dashboards
Dashboards created and released before December 2022 are considered Classic and navigation is slightly different than the newer dashboards (as described in the Navigating Dashboards section). The Classic Dashboard navigation is described in this section.
The Classic navigation functionality applies to the following dashboards:
-
Caregiver
-
Case Acceptance
-
AR
-
Payroll
-
Outstanding Billing
The Dashboard Homepage
The following image illustrates the Caregiver Homepage dashboard, accessed from the main Dashboard homepage (used to demonstrate the navigation in the classic dashboard platform). This dashboard is comprised of KPI widgets (1), presenting high-level informational figures in the main panel. To the bottom of the KPIs are the chart widgets (2) illustrating data by way of chart formats (bar, line, pie, etc.) The filters (3) on the right side of the page are used to generate information on all widgets across the dashboard.
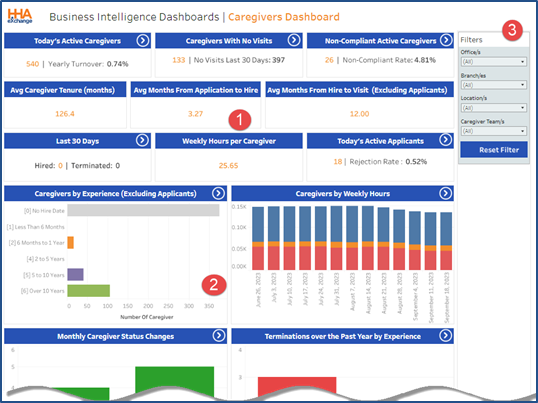
Classic Dashboard Homepage
Widget Functionality
To drill down is to move deeper into data, from high-level information to more detailed, focused information—in other words, to move downward through a data hierarchy. The following steps illustrate the process of drilling down for further information.
A Navigation (forward arrow) icon, on the right-top corner of a widget header indicates that further information is available behind the displayed data. Users can drill down by clicking on segments within the widget to access specifics. Note that not all widgets are drillable.

Drillable Widget
The following image illustrates an example of a drillable widget. To view specifics, click on any segment or point of interest of a chart within a widget. Note that tool tips populate while hovering over points in the chart to indicate specifics, as seen in the image below.
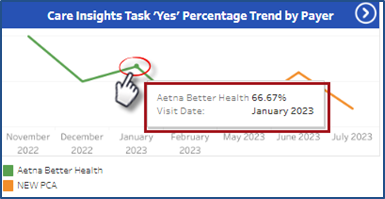
Click to Drill
A page opens showing the specifics for the selected point. In this example, there are two sections called “sheets”. The top sheet of the page shows a visual of the information while the bottom includes actual data for the visual.
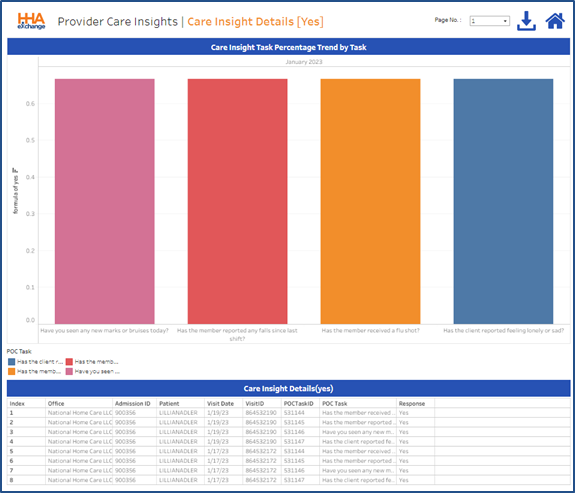
Detailed Information
Hover over any portion of a segment within the drilled information to view details and/or the description, as shown in the next two images.
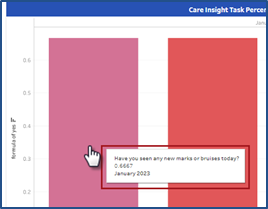
Detail Bar Graph

Detailed Report
On the top far-right section of the page, there are several options to include page navigation (if multiple pages), a download option, and a return to main dashboard option (home icon).

Details Page Options
Click on the Download icon (![]() ) to open the Download window, as seen in the image below. Select the sheet to download (hover over each option for a description) and in which available format (Excel or CSV). Click the Download button and follow the prompts.
) to open the Download window, as seen in the image below. Select the sheet to download (hover over each option for a description) and in which available format (Excel or CSV). Click the Download button and follow the prompts.
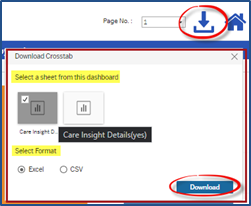
Download Crosstab Window
To return to the main dashboard, click on the home icon ( ![]() ) next to the download icon.
) next to the download icon.
Filters
Each dashboard has its own filter pane, located on the top-right, designed with criteria menus applicable to the dashboard. Like search filters, select values for the available filters to generate the information on the dashboard widgets.
To select values, click on the selection using the desired checkboxes and click on the Apply button. The information within all dashboard widgets updates dynamically according to the selected criteria. Use the Reset Filter button to clear selections. Filters are not required to generate results. Not selecting filters broadens the data displayed.
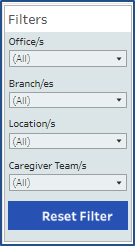
Dashboard Filter Pane on Classic Navigation